Higher education market research: why students enroll, stay or leave
20–30 minute AI-moderated interviews with students, parents, faculty, and administrators. Enrollment, retention, and program insights, with panel results in 24 hours and students on your own lists interviewed in parallel as they respond.

Walk me through the last time you made this choice. What tipped it?
The deciding reason surfaced four follow-ups deep, not in the first answer.
Trusted by teams at






Higher education market research is the practice of universities, colleges, and EdTech companies understanding enrollment, retention, and program experience — surfacing the social and identity-level drivers that ranking and cost data cannot capture. User Intuition is higher education research software powered by AI-moderated interviews, running 20–30 minute conversations with students, parents, faculty, and administrators across the lifecycle. Across 127 AI-moderated education interviews with students, parents, faculty, and administrators, User Intuition found that stated enrollment and retention drivers — ranking, location, cost — masked the emotional, social, and identity-level factors that predict yield, persistence, and program satisfaction. Those drivers only surface when students and parents describe the decision in their own words. A User Intuition education study starts at $150, returns results as participants respond, and is backed by 4.9/5 on G2 and 5/5 on Capterra. The output is practical: yield drivers by segment, persistence-risk signals, brand-perception maps, and program-fit evidence for enrollment, student success, and academic leadership at universities and EdTech companies.
What is higher education market research with User Intuition?
Higher education market research with User Intuition means AI-moderated interviews with prospective and current students, parents, faculty, alumni and employers about enrollment, retention and program decisions. Each 20–30 minute interview ladders 5–7 levels into the social, financial and identity drivers behind a choice, with 200+ panel interviews in 24 hours from a 4M+ vetted panel across 58 countries; students, parents and alumni on your CRM lists are interviewed in parallel as they respond. It serves universities, colleges and EdTech companies across admissions, curriculum, student-success and product decisions.
Who is higher education market research with User Intuition for?
Research agencies serving universities and EdTech clients, and in-house enrollment, institutional research, student-success and EdTech product teams.
How does AI-moderated education research work?
Add your guide and stimulus. The AI moderator interviews students, parents, faculty or alumni in voice, video or chat, and every finding links back to the recording.
What do you get from an education research study?
Yield, retention and program drivers with verbatims, reads by cohort and program, an editable presentation, and every transcript and recording.
Why does higher education market research miss the enrollment window?
Enrollment and retention move faster than institutional research cycles, and satisfaction scores stop at the surface. Here's what enrollment and institutional researchers tell us, and how User Intuition closes each gap.
- Sound familiar?
Admitted students are choosing other schools, and our yield study reports after the deposit deadline.
Enrollment yield research inside the decision window
Interview admitted-but-declined students within days of the deadline, in parallel as invitations are accepted, and learn whether aid packaging, campus culture, program reputation, location or career outcomes decided it.
- Sound familiar?
A 3.8 GPA student with high satisfaction scores transferred, and the survey can't tell us why.
Root causes of attrition and stop-out
Interviews with 5–7 level laddering separate academic fit, social belonging, financial stress and advising gaps, moving from “students are dissatisfied” to “academically capable but socially disconnected after week six.”
- Sound familiar?
We're launching a program on demand projections without hearing from the students who'd enroll.
Program design grounded in learner evidence
Interview prospective learners, employers and faculty before catalog lock, so curriculum committees debate with learner needs in hand.
- Sound familiar?
Faculty won't adopt the platform, and usage data can't tell us why.
EdTech adoption research with faculty and students
Interview adopters alongside those who abandoned the product to see whether the barrier is UX friction, training, pedagogy fit or missing LMS integrations.
- Sound familiar?
Accreditors want evidence we listen and respond. All we have is survey averages.
Accreditation-ready qualitative evidence
Every finding traces to verbatim quotes from students, faculty and employers, so self-studies and continuous-improvement reports show qualitative depth.
- Sound familiar?
Our enrollment VP left, and three years of research went with them.
Institutional memory that persists
Every interview is searchable in your Intelligence Hub, so a new dean can find the original student interviews behind a nursing enrollment decline three years later.
From learning question to student truth
Design The Study
Every study starts with a research plan. Define your question — enrollment yield, student retention, program validation, or EdTech adoption — then bring your own guide, or our AI builds the discussion guide, screener, and timeline tailored to education research cycles.
AI Conducts the Conversations
Each participant completes a 20–30 minute AI-moderated interview. The AI moderator adapts questions in real time, probing deeper when students reveal enrollment decision drivers, retention barriers, or program experience gaps that shape institutional strategy.
Get Evidence-Backed Results
After interviews are complete, you receive a full research report with quantified findings, participant verbatims, and strategic recommendations — organized by cohort, program, and respondent type with accreditation-ready evidence trails.
Create Compounding Intelligence
Every study feeds your searchable Intelligence Hub. Query past research across enrollment studies, retention analyses, and alumni outcomes. Surface patterns across cohorts and re-mine interviews for new insights — so your institutional knowledge compounds over time.
How Education Teams Use User Intuition
Enrollment Yield & Melt Analysis
Interview admitted-but-declined and deposited-but-melted students within days of decision deadlines. Uncover whether financial aid, campus visits, peer influence, career outcomes, or competitor messaging drove their decision.
Student Retention & Stop-Out Research
Pulse interviews with students who transferred, stopped out, or are at risk of leaving. Surface whether the root cause is academic fit, social belonging, financial stress, advising gaps, or expectation mismatch.
Program Design & Curriculum Validation
Interview prospective students, current learners, alumni, and employers before committing to new programs or curriculum redesigns. Validate whether proposed changes align with actual learner needs and career outcomes.
EdTech Product-Market Fit & Adoption
Understand why faculty adopt or resist your platform. Interview instructors, students, and IT administrators to surface UX friction, pedagogical misalignment, integration gaps, and training needs.
Alumni & Employer Outcome Research
Interview alumni and hiring managers to understand how well programs prepare graduates for career success. Map perception gaps between what institutions deliver and what employers need.
Student Experience & Campus Life Research
Go beyond satisfaction surveys to understand the emotional and social dimensions of the student experience. Surface belonging, mental health support perceptions, housing satisfaction, and dining quality drivers.
Why researchers choose User Intuition
User Intuition is an AI-moderated interview platform that gives research teams and agencies the depth of a senior researcher at the scale of a survey, with vetted respondents, your own methodology and evidence you can trace to the verbatim. Quality is built in: a person vets every panelist by hand, every session is screened for fraud, and you pay only for interviews that pass.
Senior-researcher depth
The moderator ladders 5–7 levels deep by default, using Reynolds and Gutman's laddering method, so you hear the reasons behind the reasons.
Your methodology, run as written
Bring your discussion guide and frameworks. Required questions stay pinned in order, word for word if you need it, study rules keep the moderator inside your compliance lines, screeners and hard quotas fill every cell to plan, and you decide how far it probes.
Every finding traces to its source
Click any theme through to the verbatim, the transcript and the recording. Every claim in the deliverable traces to what a participant said.
Respondents you can stand behind
A 4M+ vetted panel across 58 countries: a person listens to every panelist's interviews before they're accepted, then every session is screened for AI-generated or coached answers and panelists are tracked across studies. Or bring your own: customer lists, your panel provider, or respondents straight from your survey.
Deliverables ready to present
Themes, verbatims and an editable presentation for every study, plus every transcript, recording and screener answer to export into your own tools. Put your own brand on them when you need to.
Survey scale, quality-only billing
200+ panel interviews in 24 hours, with no cap on parallel conversations. Each one is scored on length, depth and coverage, and you pay only for those that pass.
- Isolated workspaces
- Confidential stimulus
- Never used to train AI models
- GDPR & CCPA compliant
- SOC 2 Type II examination underway
- Security →
How Does User Intuition Compare to Student Surveys, Focus Groups, and IR Dashboards for Education Research?
| Dimension | User Intuition | Student Surveys (EAB / Ruffalo Noel Levitz) | Focus Groups | IR Dashboards |
|---|---|---|---|---|
| Depth of Insight | 20–30 min conversations probing 5–7 levels into emotional and social drivers behind enrollment and retention decisions | 10–15 min surveys; captures satisfaction scores without root-cause depth on why students leave | 60–90 min groups but social pressure suppresses honest disclosure about institutional shortcomings | Quantitative indicators; shows what happened, not the motivation or experience behind it |
| Time to Insights | 24 hours from panel study launch to full report | Semester-end cycles; insights arrive after decisions that could have used them | 6–12 weeks per project including recruitment, facilitation, and synthesis | Real-time dashboards but lagging indicators — show outcomes, not causes |
| Cost per Study | From $150 (5 interviews at $30 each, using your own audience) | $15K–$50K annual platform subscription; limited qualitative depth | $15K–$75K per project including recruitment and facilitation | Built into IR budget but can't answer qualitative questions |
| Enrollment Yield Research | Direct interviews with admitted students revealing why they chose competitors — financial aid, culture, outcomes | Can survey admitted students but limited to surface-level stated preferences | Small sample of admitted students; 6–12 week timeline misses yield window | Shows enrollment patterns but can't explain individual decision drivers |
| Retention Root-Cause Analysis | Laddered interviews revealing fixable vs. structural attrition drivers — belonging, advising, financial stress | Satisfaction scores identify dissatisfaction but not the specific root causes | Can explore retention but small sample limits pattern detection across cohorts | Tracks retention rates and risk indicators but can't explain the why |
| Consumer Language | Full verbatim transcripts — usable directly in accreditation evidence and strategic planning | Numeric scores and brief open-text; limited student voice | Transcripts available but shaped by group dynamics | Data visualizations and tables; no student or stakeholder voice |
| Knowledge Retention | Searchable intelligence hub that compounds across every study, cohort, and program | Survey data stored per wave; no cross-study synthesis across years | Project deliverables filed away; each engagement starts from zero | Historical data available but siloed by report and not searchable by theme |
| Accreditation Evidence | Evidence-traced findings with verbatim quotes for continuous improvement documentation | Numeric satisfaction data; limited qualitative depth for accreditation narrative | Rich qualitative data but expensive and infrequent for continuous evidence | Quantitative benchmarks useful for accreditation but lack stakeholder voice |
Hear the interviews. See the presentation.
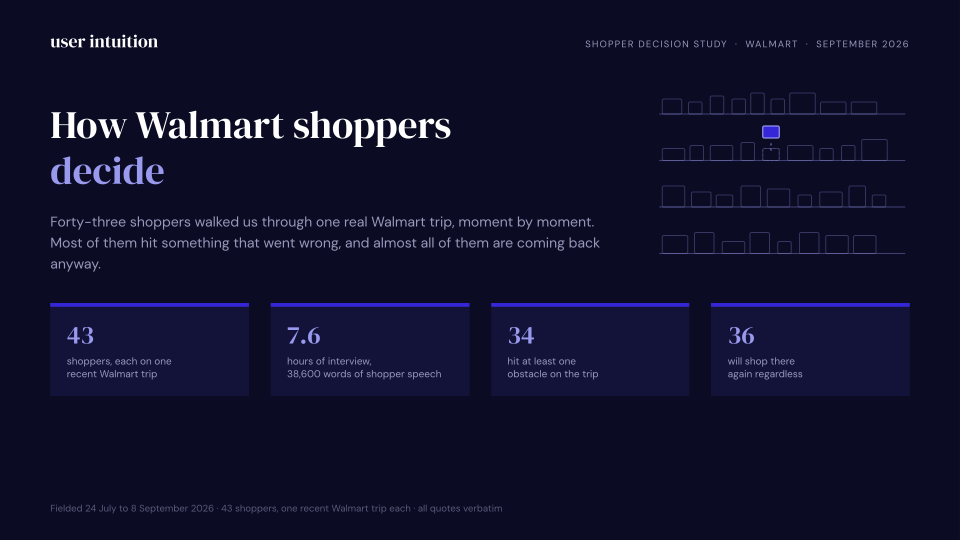
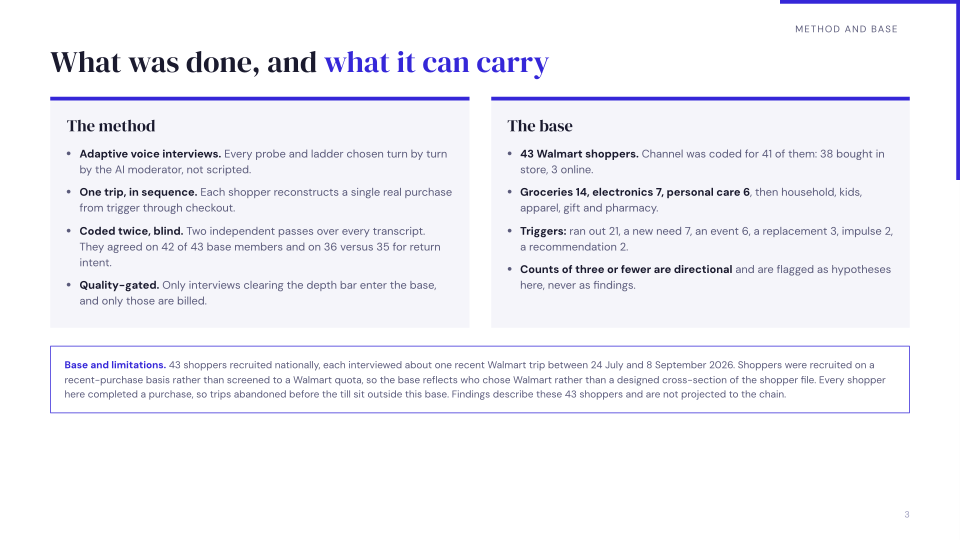
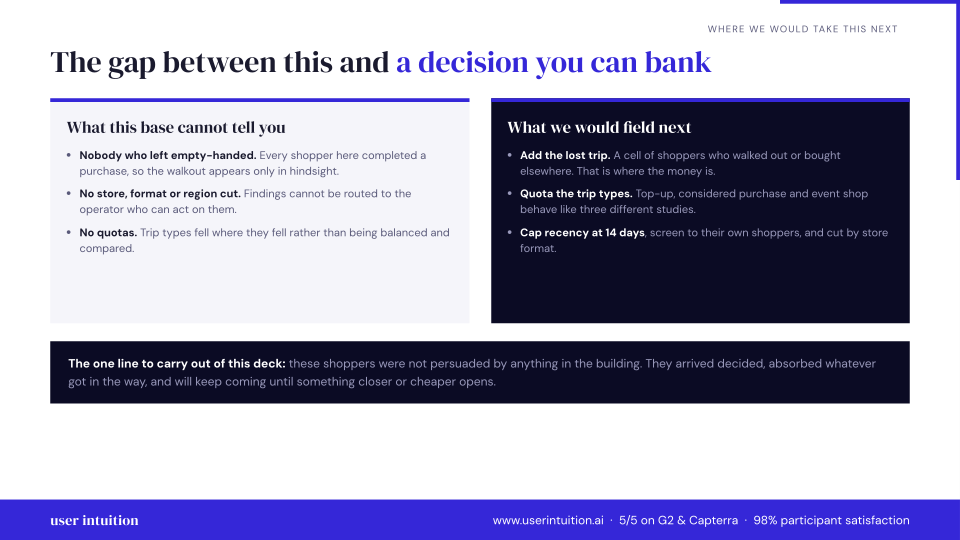
Explore calls and a sample presentation from our 43-participant Walmart shopper study.
Grocery top-up, supercenter
“Basically, because we use those things all a lot We try to always have you know, certain things in the house at all times because we use them very frequently. So we don't like to run out of them.”
What was making you want those specific things right then? Beyond just being out? Was it about being able to make certain meals or something else?
Basically, because we use those things all a lot We try to always have you know, certain things in the house at all times because we use them very frequently. So we don't like to run out of them.
Phone replacement, unplanned and urgent
“It made me feel so safe so relieved, and it brightened my day.”
Sounds like you knew exactly what you want. A Google Pixel 6 Pro. What was it about that phone that made it the right choice for you, especially in that moment?
Yeah. Thank you. So the the the phone had a lot of features. I I heard friends were talking about this phone. So in terms of the camera setting, it can take pictures and refine them into good quality. It has its own internal scanner, like I don't need to download other apps to scan to do scans. And of course, it has high quality for recording, which has been helping me in my meetings. In the office. So it's really amazing, and I love festival the quality of the phone in terms of the camera, because the previous phone I had was a Samsung. And the quality was really frustrating. And it had it has a very good processor speed as well. It's very fast. It's very efficient, and I like it. I like it. I'm enjoying the features.
Sample presentation
Preview three slides, or download the full 15-slide presentation.
Bring your own sample
$30 per quality voice interview
Use our 4M+ vetted panel
$60 per quality voice interview
What researchers say
"It tells us what's actually going on under the number. We had dashboards coming out of our ears, we knew the second NPS dropped or churn ticked up, but a dashboard never told us what the customer actually went through to feel that way."
Walter A., Quality Assurance Specialist, Mid-Market
Common questions
Run your first education research study this week
Whether you're diagnosing enrollment yield, understanding student attrition, or validating a new program, get research-quality answers, with panel results in 24 hours and your own lists interviewed in parallel.
Launch your first study in minutes. Define your question, target your audience, and see panel results in 24 hours, or interviews with your own lists as they respond.
No sales deck. We'll map User Intuition to your next enrollment challenge, retention question, or program decision.
Walk through a real study — from interview to report. See exactly what the platform delivers before you commit.
No contract · Per-interview pricing · Panel results in 24 hours
Related research and resources
Pillar Guides
Deep-dive guides covering this topic from strategy to execution.
Tools & Tactics
Practical frameworks and platform-specific guides for teams ready to act.
Reference Guides
Reference deep-dives on methodology, best practices, and applied research.
Alternatives & Comparisons
Side-by-side comparisons with competing platforms and approaches.
Related Solutions
Complementary research use cases that pair with this topic.
Platform Capabilities
The platform features that power this type of research.
Last updated